01
Preprocess
Decode the upload, resize to the model's input resolution (299x299 for Xception, 224x224 for the custom CNN), and normalise pixel values to [0, 1].
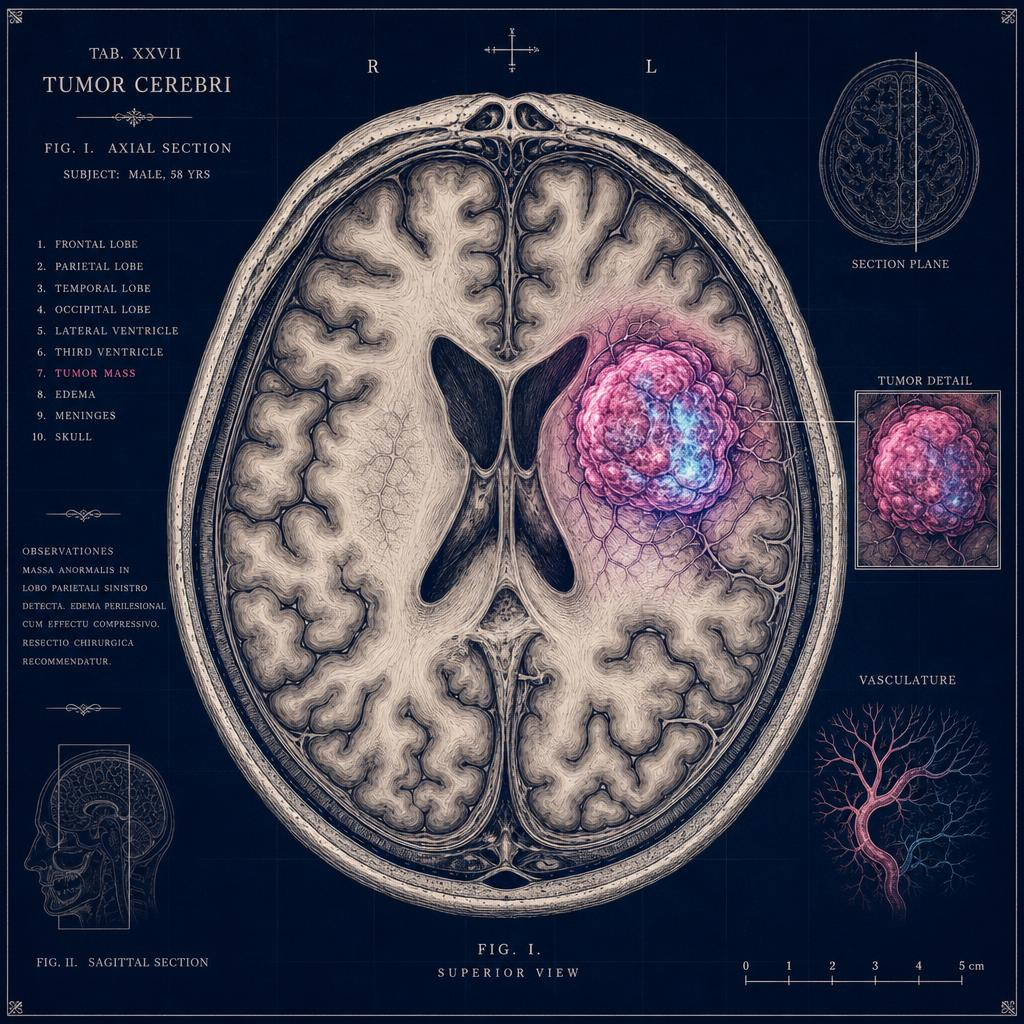
Brain Tumour Atlas
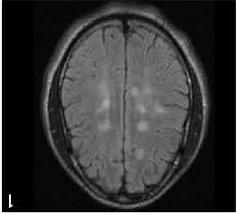
An interactive atlas. Upload a brain MRI and a deep neural network classifies it across four diagnostic categories: glioma, meningioma, pituitary, or none. It also shows you where in the scan it looked.
Console
Specimen
Bring a scan.
Drag & drop an MRI here
or
JPG, PNG, WebP. Max 10 MB.
Reading
No reading yet.
Choose a specimen above, pick a model, and click classify. The prediction, attention overlay, and a written interpretation will appear here.
Atlas
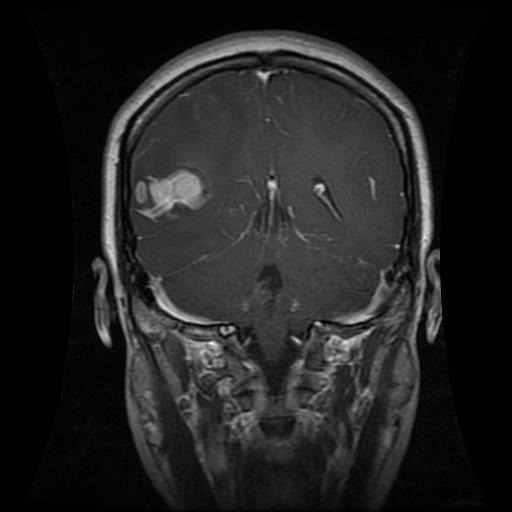
Tumors arising from glial cells in the brain or spine.
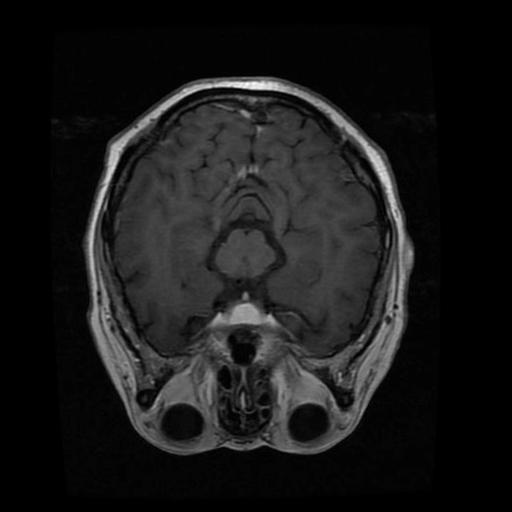
Slow-growing tumors of the meninges membrane.
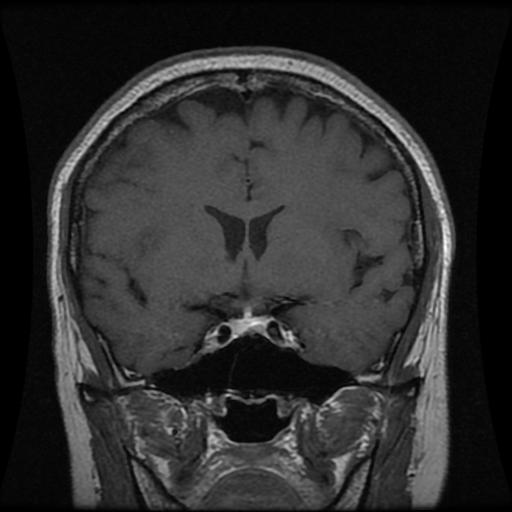
Abnormal growths within the pituitary gland.
Healthy scan classification baseline.
Method
Pipeline
Three steps, in order
01
Decode the upload, resize to the model's input resolution (299x299 for Xception, 224x224 for the custom CNN), and normalise pixel values to [0, 1].
02
Forward pass through the chosen model. The network produces a softmax over four classes; we take the argmax as the prediction and keep the full distribution for display.
03
TensorFlow's GradientTape gives a per-pixel saliency map of the predicted logit. Gemini reads the overlay back to you in plain English, in four sentences.
Appendix
Click to open
7,023 MRIs from the Kaggle Brain Tumor MRI dataset.
5,712 train, 655 validation, 656 test. The test set is split 50/50 from the original Testing folder, stratified by class with a fixed random seed.